Enjoy this Woodbridge Real Estate Market Report for this month. You can also do a home search and save your favorite properties. Set up a search and be alerted as soon as a matching property hits our database. It’s Exclusive.
What’s Your House Worth?Get an Instant EstimateContents
Woodbridge Real Estate Market Predictions 2018
Whether you’re planning to buy a new home or sell your existing home, it’s a good idea to know more about the Woodbridge real estate market before you begin. Here’s an overview of current statistics for September 2018.
The median sale price for September was $328,000. This shows an decrease from the $330,000 recorded last month. The median sale price for September also showed a 7 percent increase over $306,500 from this time last year. The median price fluctuates depending on which zip code you’re researching in the Woodbridge community.
Those in the 22192 zip code area saw a median sale price of $325,450. This amount shows a 5.7 percent increase over last year’s $208,000. Zip code area 22191 brought a median home sale price of $338,750, which is 13.3 percent higher than last September’s $299,000. The median home sale price in the 22193 zip code area is $324,000. Here we see another increase when it comes to the median sale price with a 4.7 percent rise from $319,500 last year. Read More
Market Reports from 2018
| January 2018 | February 2018 | March 2018 |
| April 2018 | May 2018 | June 2018 |
| July 2018 | August 2018 | September 2018 |
| October 2018 |
Market Report from 2017
| December 2017 |
Woodbridge Homes by Price
| All Woodbridge Listings | |
| Under 200K | Under 300K |
| Under 400K | Under 500K |
| Under 600K | Under 700K |
| Under 800K | Under 900K |
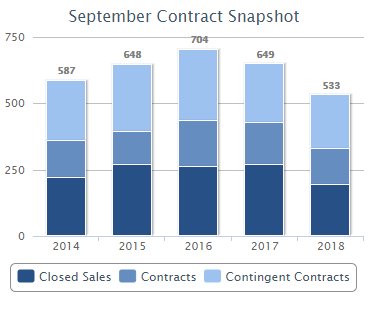
September 2018 Contract Snapshot

Woodbridge Homes for Sale
Wondering what your home might be worth? Find out instantly with our 15-second home value calculator.

